Business Intelligence

Power BI brings your data to life

Power BI is a suite of business analytics tools that deliver insights throughout your organization, you can produce beautiful reports and publish them to consume on the web and across mobile devices.

Why choose Power BI?

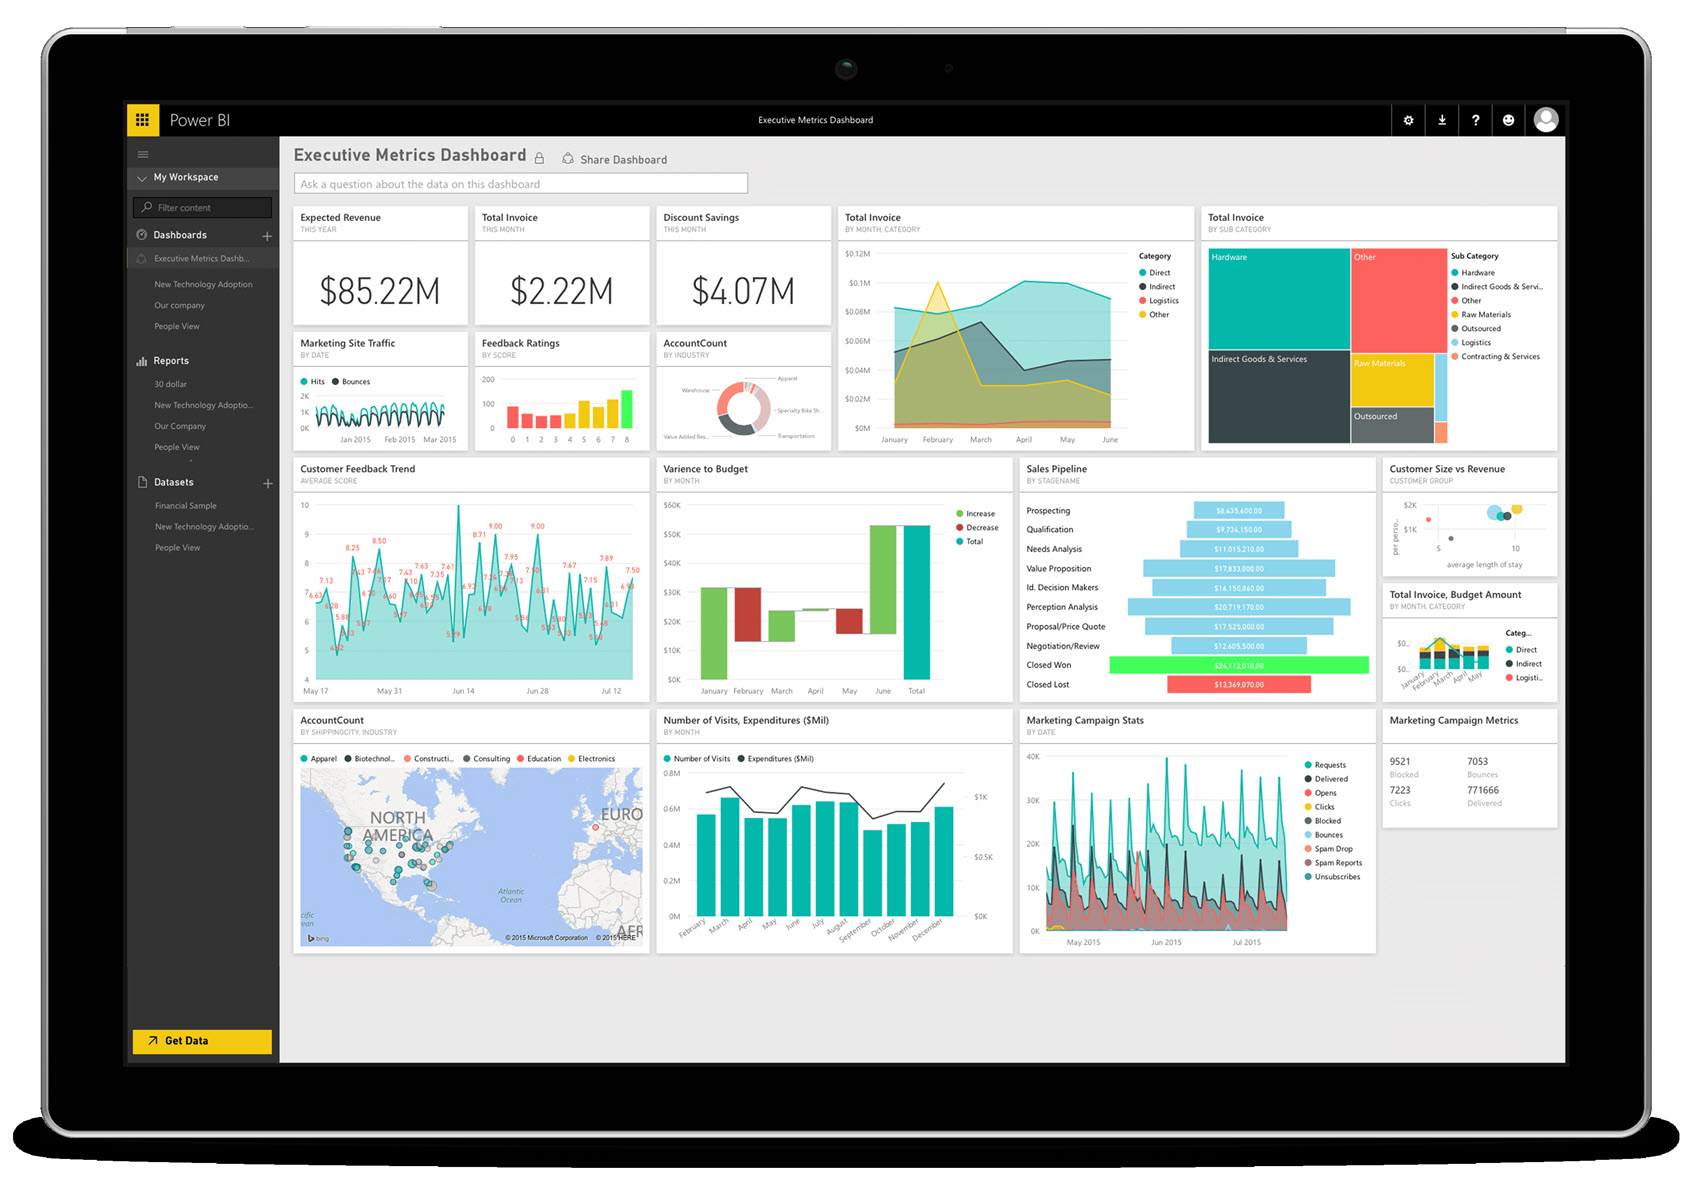
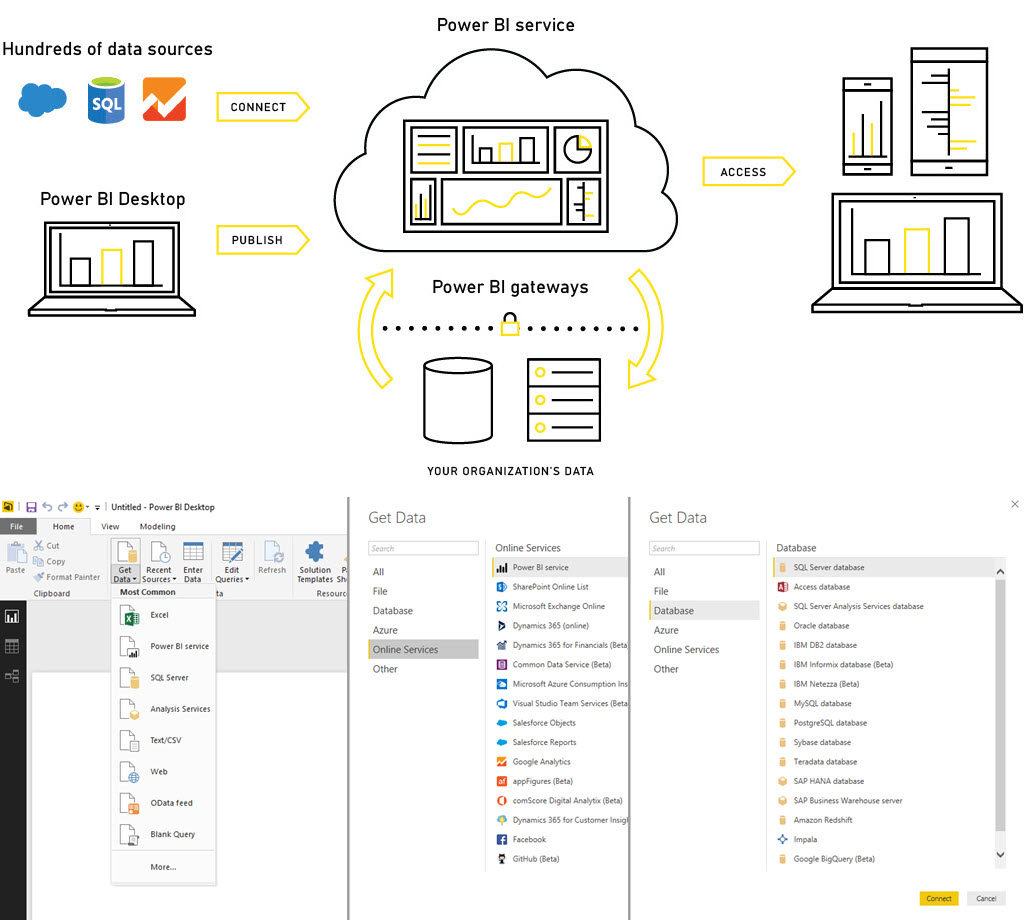
Power BI is a suite of business analytics tools that deliver insights throughout your organization. Connect to hundreds of data sources, simplify data prep, and drive ad hoc analysis. Produce beautiful reports, then publish them for your organization to consume on the web and across mobile devices. Everyone can create personalized dashboards with a unique, 360-degree view of their business – and scale across the enterprise, with governance and security built-in. Explore your data wherever it is — in the cloud or on-premises, including big data sources.

Business
Analytics

Enable users to dig deeper into data and find patterns they may have otherwise missed.

Data
Visualization

Create stunning reports with interactive data visualizations. Publish easily to the cloud.

Interactive
Reports

With features like quick measures, grouping, forecasting, and clustering for desktop and mobile.

Multiple
Data Sources

All your data, wherever it is spreadsheets, cloud services, streaming data, and databases.

Features and benefits

Empower everyone with actionable insight

See all your data through a single pane of glass. Live Power BI dashboards and reports include visualizations and KPIs from your data in the cloud and on-premises, offering a consolidated view across your business, regardless of where your data lives.
Power BI let’s you make data driven decisions!

Provide advanced analytics with the familiarity of Excel

Clean, transform, and mash up data from multiple sources—in a few clicks. Enable business users to dig deeper into data and find patterns they may have otherwise missed, with Power BI features like quick measures, grouping, forecasting, and clustering. If you’re familiar with Excel, you’ll feel at home in Power BI.

Author for everyone, anywhere

Create mobile-optimized reports for viewers to consume on the go. Publish from Power BI Desktop to the cloud or on-premises. Embed reports created in Power BI Desktop into existing apps or websites. Create stunning reports with interactive data visualizations.
Tell your data story using a drag-and-drop canvas and data visuals.

Connect to your data, any data

Explore your data wherever it is—in the cloud or on-premises—including big data sources such as Hadoop and Spark. With connections to hundreds of sources and constantly growing, Power BI Desktop lets you draw deep insights for a broad range of scenarios.

Data is at the heart of Power BI. Whenever you’re exploring data, creating charts and dashboards, asking questions with Q&A, all of those visualizations and answers you see are really getting their underlying data from a dataset.

But where does that dataset come from? Well, from a data source.

Power BI Live Demo

TEST AN INTERACTIVE DASHBOARD

Dashboards are a great way to monitor your business, to look for answers, and to see all of your most-important metrics at a glance. The visualizations on a dashboard may come from one underlying dataset or many, and from one underlying report or many – providing a consolidated view.
Usage Tip: Left/right arrows are used to navigate between dashboards – click the arrow in the bottom right corner for fullscreen view.

Learn more about Power BI:

Frequently asked questions

Which other cost do I have to consider for the implementation of Power BI?

The basic installation of the system is included in the service cost. Other implementation costs such as configuration, employee training, data migration, detailed adaptation, development will vary depending on the size of the implementation and the usage of the system. Get in touch with us here for a detailed quotation.

How long does it take to complete the implementation of Power BI?

Implementations with basic reports can take somewhere between 2 to 4 weeks, this will vary depending on the type of business and on a ‘case by case’ basis. Another part of the Power BI implementation is the customization – this is the part where the estimation solely depend on the modifications you want.

Can Power BI be connected to other third-party systems and solutions?

Yes, in our live demo section you can test such an integration between Power BI and Odoo CRM/ERP. Our development team has already made connections to well known systems such as Sage, Amazon, EBay, WooCommerce, PayPal, QuickBooks, MailChimp, and many more.

Can I access Power BI from a mobile device when I’m out the office?

Yes, you can monitor your business right from your phone. Securely access and view live Power BI dashboards and reports on any device, share live reports and dashboards directly from the app to keep your team on the same page – the Power BI app is available for iPhone and Android.

About Eazy-Office

We help businesses by facilitating access to professional web solutions and services – boosting performance with tailored consultancy, we’re covering all the steps from assessment to implementation. We work closely with our clients – ensuring the most optimal solution is selected for their business.

Lars J. Croff
Founder and CEO of
Eazy-Office.com

How we help
your business?

Our three-step Power BI consultancy process:

Our Pricing

POWER BI

INTEGRATION SERVICES
99 Per Hour (excl. VAT)
  • We propose a Power BI configuration
  • We implement the Power BI configuration
  • We introduce the Power BI solution
  • Minimum purchase is 10 hours at €99/h (€990).

POWER BI

SUPPORT & MAINTENANCE SERVICES
899 Per Month (excl. VAT)
  • Phone & email support
  • Remote assistance & resolution
  • Response time: 2 to 4 hours
  • If support is needed outside hours it costs €99/h.
08:00-17:00

Having questions?

Call us at +46 (0)764-668 600